

Walk into almost any small shop in late October and you will find the same thing in the back room: boxes. Some of it is the holiday stock that will fly out the door in six weeks. Some of it is the stuff you bought last spring because the rep swore it would sell. Both piles cost you the same money to buy, but only one of them is turning back into cash. Your inventory turnover ratio is the number that tells you which is which, and once you start watching it, you will never look at a full shelf the same way again.
Here is the uncomfortable truth: every product sitting on your shelf is cash you already spent and have not gotten back yet. The faster it sells, the faster that money comes home to pay rent, payroll and the next order. This guide covers what the ratio actually measures, the simple formula, what a healthy number looks like for different kinds of businesses, and the practical tricks owners use to speed it up without running out of the things customers came in for.
What Your Inventory Turnover Ratio Actually Measures
In plain English, the inventory turnover ratio tells you how many times you sell through and replace your average stock during a period, usually a year. A ratio of 6 means you emptied and refilled your shelves roughly six times. A ratio of 2 means your average item sat around for about six months before somebody bought it.
Think of it as a speedometer for your money. Revenue tells you how much you sold. Margin tells you how much you kept on each sale. Turnover tells you how hard your inventory dollars are working while they wait. Two stores with identical sales and identical margins can have completely different cash situations if one turns its stock eight times a year and the other turns it three.
It is also an early warning light. A falling ratio usually shows up months before the problem lands in your bank balance. Slowing sales, over-ordering, a vendor minimum that pushed you into buying too deep, a trend that faded: they all show up in turnover first.
Turnover vs. days on hand
You will often see turnover paired with a second number called days inventory outstanding, or simply days on hand. It is the same idea flipped around. Divide 365 by your turnover and you get the average number of days an item sits before it sells. A turnover of 5 works out to about 73 days. Some owners find days easier to feel in their gut, because “this stuff sits for 73 days” is more vivid than “we turn five times.”
How to Calculate Inventory Turnover Ratio
The standard formula is refreshingly short:
Inventory turnover ratio = Cost of goods sold / Average inventory
Cost of goods sold, or COGS, is what you paid for the products you actually sold during the period. Average inventory is your beginning inventory plus your ending inventory, divided by two, measured at cost. Use cost on both sides. Mixing retail prices with cost is the most common mistake owners make, and it inflates the result so the number looks healthier than it is.
A quick worked example
Say you run a gift and home goods store. Last year your cost of goods sold was $240,000. You started the year with $55,000 of inventory at cost and ended it with $45,000.
- Average inventory = ($55,000 + $45,000) / 2 = $50,000
- Inventory turnover ratio = $240,000 / $50,000 = 4.8
- Days on hand = 365 / 4.8 = about 76 days
So on average, every dollar you put on the shelf takes about two and a half months to come back. That is not bad for a gift shop, but it is a starting point, not a finish line. If you want a refresher on the cost side of that math, our guide to markup vs margin walks through why cost and price have to be kept in separate lanes.
Use averages that actually reflect your year
If your business is seasonal, a simple beginning-plus-ending average can be misleading. A store that is stuffed to the rafters in November and nearly empty in January will look very different depending on which month you measure. The fix is easy: average your inventory value at the end of each month, all twelve of them. Most modern POS systems will hand you those snapshots in seconds.

What Is a Good Inventory Turnover Ratio?
There is no single magic number, and anyone who gives you one without asking what you sell is guessing. Turnover depends heavily on the shelf life and price point of what you carry. A rough way to think about it:
- Restaurants, cafes and bakeries: very high turnover, often weekly for perishables. Food that sits is food you throw away.
- Grocery and convenience stores: fast turnover on most items, frequently in the double digits per year.
- Apparel and boutiques: moderate, often in the 3 to 6 range, with sharp seasonal swings.
- Gift, home goods and specialty retail: moderate, commonly 3 to 5.
- Furniture, jewelry and high-ticket goods: slow by nature, sometimes 1 to 3, because each sale is large.
For a wider lens, the U.S. Census Bureau tracks how much inventory retailers carry relative to monthly sales, and the retail inventories-to-sales ratio published on FRED has hovered around 1.26 in 2026. Put simply, the typical American retailer is holding more than a month of sales in stock at any given moment. That is the national average, though. The number that really matters is your own inventory turnover ratio compared with your own history.
When a high number is a problem
Faster is usually better, but not always. A turnover ratio that is unusually high can mean you are running too lean: frequent stockouts, empty pegs and customers walking out to buy from someone else. Stockouts never show up in your sales report because the sale simply never happened. If your ratio climbs and your complaint count climbs with it, you have tipped over from efficient to understocked.
Track the trend, not just the snapshot
The most useful comparison is you against you. Calculate your ratio for the same period last year, then look at it quarterly. A slow, steady decline is a signal to dig in before the cash squeeze arrives.
Why a Slow Inventory Turnover Ratio Quietly Drains Your Cash
Slow-moving stock does not just sit there politely. It costs you every single month it stays on the shelf. Accountants call this carrying cost, and it adds up from several directions at once:
- Tied-up cash: money in inventory is money you cannot use for payroll, marketing or an emergency.
- Storage and space: every square foot holding dead stock is a square foot not holding something that sells.
- Shrink and damage: the longer items sit, the more chances they have to break, expire, fade or walk out the door. Our post on inventory shrink covers the controls that help.
- Markdowns: eventually you discount the leftovers, and that markdown comes straight out of your margin.
This is not just a small business headache. Retail research firm IHL Group estimated that inventory distortion, meaning the combined cost of out-of-stocks and overstocks, was costing retailers worldwide about $1.73 trillion a year, even after $172 billion in improvements, according to its 2025 inventory distortion study. Big chains with full planning departments still get this wrong. The difference is that they have deep pockets to absorb it. Most independent shops do not.
That is why your inventory turnover ratio belongs right next to your cash balance on the list of numbers you check. If cash feels tight even though sales look fine, slow inventory is one of the first places to look. Our 13-week cash flow forecast guide shows how to see that squeeze coming before it hits.
Practical Tricks to Improve Your Inventory Turnover Ratio
Improving turnover comes down to two levers: sell faster or buy smarter. The best results come from pulling both at once. Here are the moves that work for real-world shops, not just big-box planners.
1. Find your dead stock and deal with it
Run a report of every item that has not sold in 90 days. That list is your dead stock. Bundle it with a bestseller, move it to a high-traffic spot near the counter, run a short promotion, or return it to the vendor if your terms allow. Accept a small loss now instead of a bigger one in six months.
2. Reorder by the numbers, not by feel
Set reorder points based on how fast each item actually sells and how long your vendor takes to deliver. Fast movers get reordered more often in smaller quantities. Slow movers get a hard look before you ever buy them again. If you already forecast demand, our sales forecasting guide pairs perfectly with this step.
3. Buy shallower and more often
Vendor price breaks for big orders are tempting, but a 5% discount does not help if the extra units sit for nine months. Where you can, order smaller quantities more frequently. You will hold less cash in the back room and react faster when a product cools off.
4. Sell what moves where customers see it
Merchandising matters. Put your fastest sellers and best margins at eye level and near the register, and use end caps for items you need to move. Small changes in placement can noticeably speed up the items you most need to turn.
5. Trim the long tail
Most shops find that a small slice of their catalog drives most of their sales. Look at the bottom 20% of items by units sold. If something is taking up shelf space, buying budget and counting time without pulling its weight, stop reordering it.

Let Your POS Do the Inventory Turnover Ratio Math
You can calculate all of this with a spreadsheet and a clipboard, but that usually means it gets done once a year, if that. The owners who actually improve their inventory turnover ratio are the ones who can see it without effort. That is where a modern POS earns its keep.
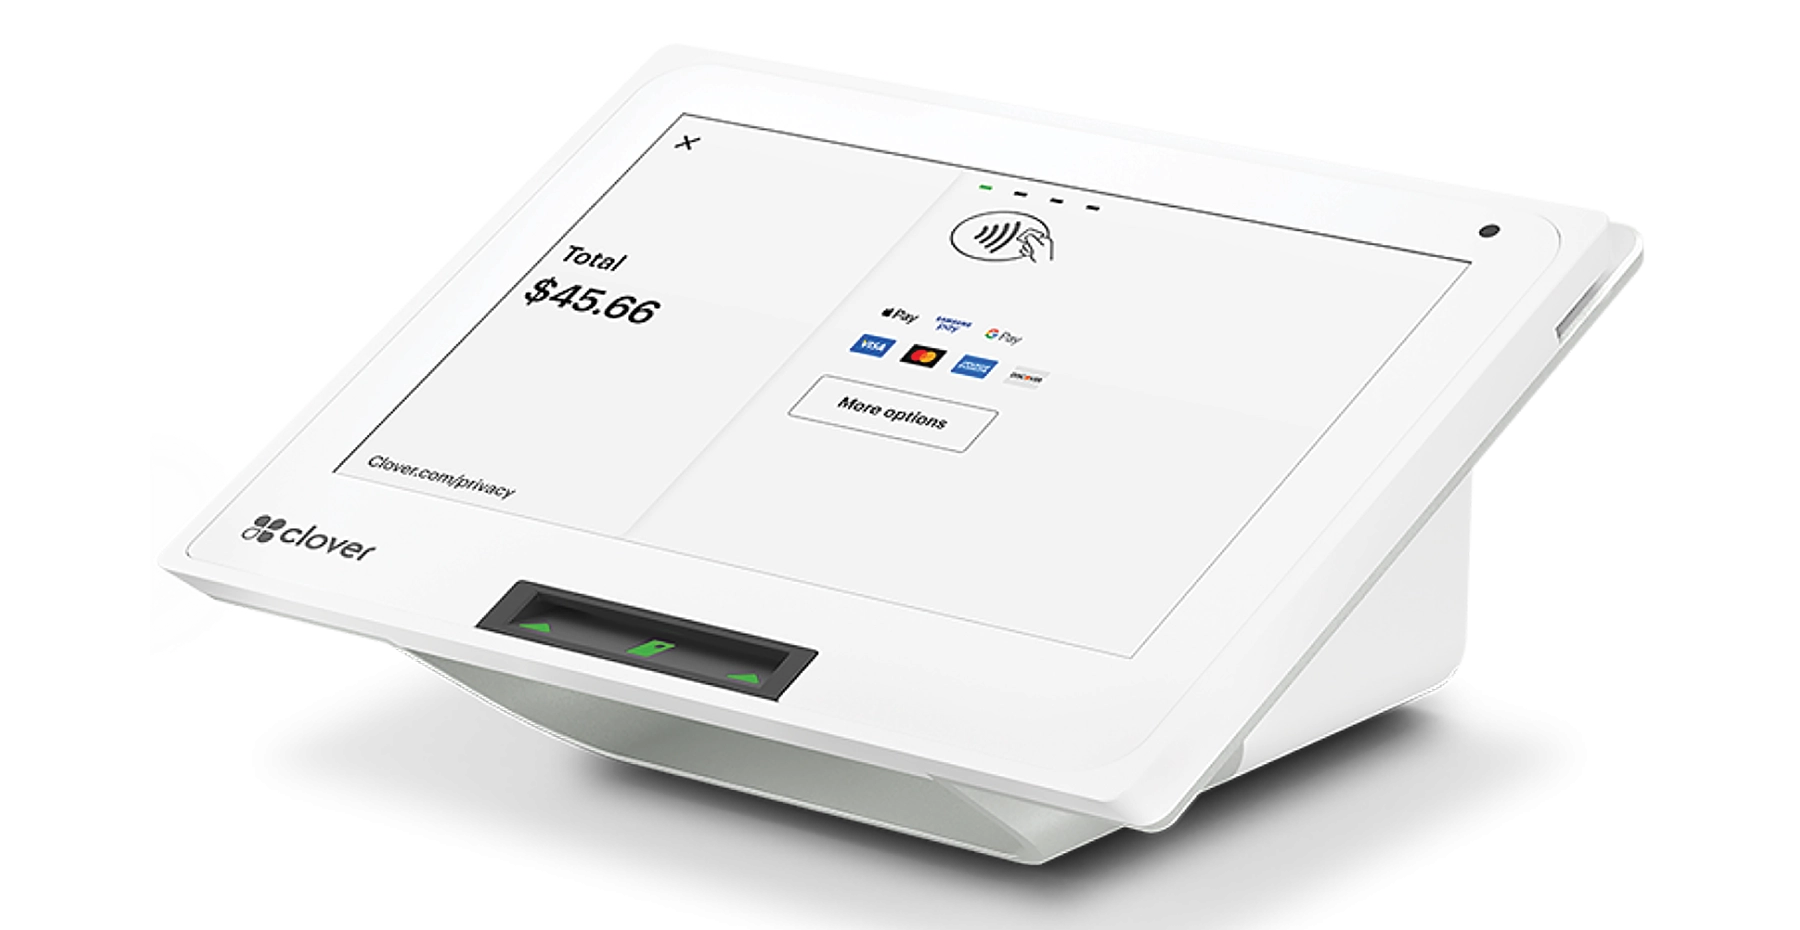
A system like the Clover Mini tracks item-level sales and stock counts automatically with every transaction. Instead of guessing, you can pull reports by item, category or vendor, spot slow movers, and set low-stock alerts so you reorder before you run out. Our guides to POS reporting and small business inventory management go deeper on which reports matter most, and our breakdown of retail metrics shows how turnover fits alongside sell-through and margin.
Make it a monthly habit
Pick a day each month, maybe the first Monday, and spend twenty minutes on three questions. What is my inventory turnover ratio this month compared with last year? Which ten items have sat the longest? Which items did I run out of? Those three answers will guide your next round of ordering better than any sales rep ever could.
Keep more of every sale while you are at it
Speeding up turnover puts cash back in your hands. Lowering what you pay to accept that cash keeps more of it there. Many of the shops we work with pair better inventory habits with our Zero Fee Processing program, which can dramatically cut card processing costs. And if a big seasonal buy is unavoidable, flexible working capital can bridge the gap until the stock sells through, instead of draining your operating account.
Ready to see which products are tying up your cash?
VMS sets you up with a Clover POS that tracks stock and sales by item in real time, plus transparent pricing — most businesses are up and running within days.
Or call our team: 888-902-6227
Turn Your Shelves Back Into Cash
Every business with a stockroom is running a quiet race between what it buys and what it sells. Your inventory turnover ratio is the scoreboard for that race. Calculate it with cost of goods sold and average inventory, compare it against your own history and your type of business, then use the simple levers in this guide to speed it up: clear the dead stock, reorder by the numbers, buy shallower, merchandise smarter and let your POS track the details.
You do not need to hit some perfect benchmark. You just need to know your number, watch the trend and make one better buying decision at a time. Do that for a year, and you will feel the difference in your bank account long before you see it in a report. If you want a POS that makes the inventory turnover ratio easy to track, or you have questions about payment processing for retail, check our merchant services FAQs or reach out to the VMS team below.
Have questions about tracking your inventory turnover ratio?
Fill out the form below and a VMS payment specialist will contact you shortly.