

Most cash crunches don’t arrive as a surprise. They arrive as a surprise to the owner. The rent, the payroll, the quarterly tax payment, the supplier who wants to be paid on delivery — every one of them was sitting on a calendar somewhere. A 13 week cash flow forecast simply puts all of those dates on one page, right next to the money you expect to come in, so the lean weeks show up while you still have time to do something about them.
That is the whole trick. It isn’t a fancy accounting report, and it isn’t something only CFOs at big companies build. Lenders and turnaround advisors lean on the 13 week cash flow because thirteen weeks is exactly one quarter: long enough to see a problem forming, short enough that your estimates are still honest.
If you run a shop, a restaurant, a salon or a service business, this guide walks you through building one in an afternoon, what goes in each row, how to read it without panicking, and the handful of levers — including a few hiding in your payment processing — that move the numbers when a week turns red.
Why a 13 Week Cash Flow Beats Your Monthly P&L
Your profit and loss statement tells you whether you made money last month. It doesn’t tell you whether there will be enough in the account on the 14th, when payroll and the equipment lease hit on the same day. Profit and cash are different animals, and if you want a refresher on the difference, our guide on how to read a profit and loss statement covers it in plain English. A month can look wonderfully profitable on paper while the checking account runs dry because a big catering invoice hasn’t been paid yet.
A 13 week cash flow forecast fixes that blind spot by working in weeks instead of months, and in cash instead of accounting entries. Every line is a real deposit or a real withdrawal on a real date. Nothing is “earned” until it lands in the bank, and nothing is “paid” until it actually leaves.
Thirteen weeks is the sweet spot
Go shorter and you only spot trouble when it’s already on the doorstep. Go longer and your guesses get fuzzy — nobody knows what October’s walk-in traffic will look like back in March. Thirteen weeks covers one full quarter, which means the plan naturally catches your quarterly estimated tax payment, most seasonal swings, and the renewal date on that annual insurance premium you forget about every single year.
Most shops run closer to the edge than they think
The JPMorgan Chase Institute studied the transactions of nearly 600,000 small businesses and found the median one held just 27 days of cash buffer — about four weeks of outflows if every deposit stopped at once. For restaurants and retailers the median was thinner still, around 19 days, and restaurants alone averaged 16. Put another way: for a typical shop, the distance between “we’re fine” and “we can’t make payroll” is less than a month.
The Federal Reserve’s newest survey of small employers points the same direction. In its 2026 Report on Employer Firms, rising costs of goods, services and wages was the most commonly reported financial challenge, 38% of firms applied for a loan, line of credit or merchant cash advance in the prior year, and plenty of applicants came away with less than they asked for. When financing is that hard to land, spotting a shortfall six weeks out instead of six days out is the difference between asking calmly and asking desperately.

How to Build a 13 Week Cash Flow Forecast in One Afternoon
A 13 week cash flow doesn’t need special software. A spreadsheet with fourteen columns — one for labels plus one for each week — is plenty. Put the Monday date at the top of each week, pour a coffee, and block out two or three hours. Here’s the order that works best.
Step 1: Start with the cash you actually have
Row one is your opening balance: what’s in your operating account today. Not what the banking app calls “available” before pending items clear — what is genuinely there to spend. If you keep a separate reserve or tax account, give it its own line so you can see it without being tempted to raid it.
Step 2: List every dollar you expect to come in
Break inflows into the few buckets that matter for your business. For most small merchants, that looks like this:
- Card sales deposits — your weekly card volume, placed on the day your processor actually funds it, not the day of the sale.
- Cash sales — register cash you deposit, on the day you deposit it.
- Invoices and receivables — only in the week you realistically expect to be paid, which is often later than the due date.
- Recurring revenue — memberships, subscriptions and service contracts.
- Everything else — vendor refunds, loan proceeds, or money you put in yourself.
Use the same weeks from last year as your baseline, then adjust for what you already know: a price increase, a new product line, a slow construction season on your street. If you run on Clover, your weekly sales history is already waiting in the Clover Dashboard, which makes this step far faster than digging through bank statements with a highlighter.
Step 3: List every dollar going out, on the day it leaves
This is where a 13 week cash flow earns its keep, because timing matters more than totals. Payroll every other Friday. Rent on the first. Sales tax on the twentieth. The supplier you pay weekly, and the one who invoices net-30. Loan and lease payments, insurance, software subscriptions, card processing fees — and the quarterly estimated tax payment that appears exactly once a quarter and ruins that week every time.
Don’t leave yourself off the list. If you take a regular draw or salary, it belongs on the forecast like any other bill, and our guide on how to pay yourself explains how to size it. The same goes for the equipment you already know needs replacing this quarter.
Step 4: Do the simple math across the row
For each week of your 13 week cash flow: opening balance, plus inflows, minus outflows, equals closing balance. That closing balance becomes next week’s opening balance. Drag the formula across all thirteen columns and your whole quarter appears at once.
Then add the row that matters more than any other: your minimum comfortable balance. Pick a floor — two weeks of fixed expenses is a sensible start — and highlight any week where the closing balance dips below it. Those highlighted weeks are the entire reason you built the 13 week cash flow in the first place.
| Row | What goes in it | Where to find the number |
|---|---|---|
| Opening balance | Cash in the operating account at the start of the week | Your bank account, minus anything already committed |
| Card deposits | Card sales, placed on the day they actually fund | POS sales reports and your processor’s deposit history |
| Cash and other income | Register cash, invoices you expect paid, recurring revenue | Deposit slips, invoicing software, member lists |
| Fixed outflows | Rent, payroll, loans, leases, insurance | Your lease, payroll calendar and loan statements |
| Variable outflows | Inventory, supplies, processing fees, repairs | Supplier invoices and three months of statements |
| Closing balance | Opening balance plus inflows minus outflows | Calculated; it becomes next week’s opening balance |
| Minimum floor | The balance you never want to drop below | Your call; two weeks of fixed costs is a common start |
Reading the Forecast Without Panicking
The first time you finish a 13 week cash flow forecast, there’s a decent chance at least one week goes red. That isn’t failure. That’s the tool doing its job. A red week eight weeks from now is a planning problem. A red week discovered on a Thursday afternoon is an emergency.
Look at the shape, not just the low point
Is the dip a single week, caused by one big payment landing on top of payroll? That’s a timing fix: move a payment, ask a vendor for a later date, or pull a deposit forward. Is the balance sliding a little lower every week? That’s structural — costs are outrunning sales — and shuffling dates will only delay the conversation. Those two shapes need completely different responses, and the forecast is what tells them apart.
Roll it forward every week
A forecast you build once and never touch is just a guess with nice formatting. Once a week — same day, same time, fifteen minutes — replace last week’s estimates with what actually happened, drop the oldest week, and add a fresh week thirteen on the end. That rolling habit is what turns a spreadsheet into a real 13 week cash flow system, and it quietly sharpens your estimates every week because you can see exactly where you were wrong.
Keep score on your own guesses
Keep a small forecast-versus-actual note on your 13 week cash flow for card deposits and your three biggest expense lines. If you’re consistently ten percent optimistic on sales, you now know to shave your projections. Most owners who stick with it for one quarter say the same thing: the 13 week cash flow stops feeling like homework and starts feeling like the gauge cluster in a car.

Five Levers That Turn a Red Week Back to Black
Once your 13 week cash flow shows you a problem, you have more options than you might expect. These are the ones that work fastest, roughly in the order most owners should try them.
1. Get paid faster
Every day between a sale and its deposit is a day your money works for someone else. If card deposits take two or three business days to land, faster funding pulls real cash into the weeks where you need it most. Many merchants can move to next day funding, which shifts the entire card-deposit row a day or two earlier. Settling your batch every night, instead of letting transactions sit, helps too — here’s why batching can make or break your cash flow.
For invoice-based businesses, the lever is collection speed. Sending an invoice with a pay-by-card link the day the work is done, rather than at month end, shortens the wait dramatically — see our guide to online invoicing for small business. And recurring billing for memberships and service plans turns a guess into a predictable row.
2. Cut what you pay to get paid
Processing fees are one of the few expenses that repeat every single week and grow automatically as your sales grow. They’re also easy to miss on a forecast, because they come out of your deposits rather than arriving as a separate bill, so they quietly shrink every card-deposit number on the sheet. A Zero Fee Processing program offsets card fees with a compliant pricing adjustment and can take most of that line close to nothing. Even if you keep traditional pricing, a review of your credit card processing fees often finds money you didn’t know you were leaving on the table.
3. Move the timing of your outflows
Ask the suppliers behind the biggest lines on your 13 week cash flow whether they’ll push your due date a week, or move you from net-15 to net-30. Many will, especially if you’ve been a reliable customer. Schedule big optional purchases for the weeks your forecast shows as strong, not the weeks it shows as thin.
4. Line up backup before you need it
The best time to arrange financing is when your 13 week cash flow says you won’t need it for two months. Lenders read a forecast like this favorably because it proves you understand your business, and you’re asking from a position of calm. Flexible working capital repaid as a share of card sales can bridge a seasonal gap without a fixed payment landing in your worst week, and knowing how to establish business credit ahead of time widens your options even further.
5. Fix the cost lines that grow on their own
If the balance slides every week rather than dipping once, the fix lives in your margins: staffing, pricing and inventory. Checking your labor cost percentage and learning how to raise prices without losing customers are two of the most direct places to start.
Where Your POS Makes the 13 Week Cash Flow Easier
The hardest part of any forecast is getting honest numbers for the inflow rows, and that’s exactly the data your point of sale already collects. Modern POS devices report sales by day, by week, by payment type and year over year, so building your card and cash baseline takes minutes instead of an evening with old receipts.
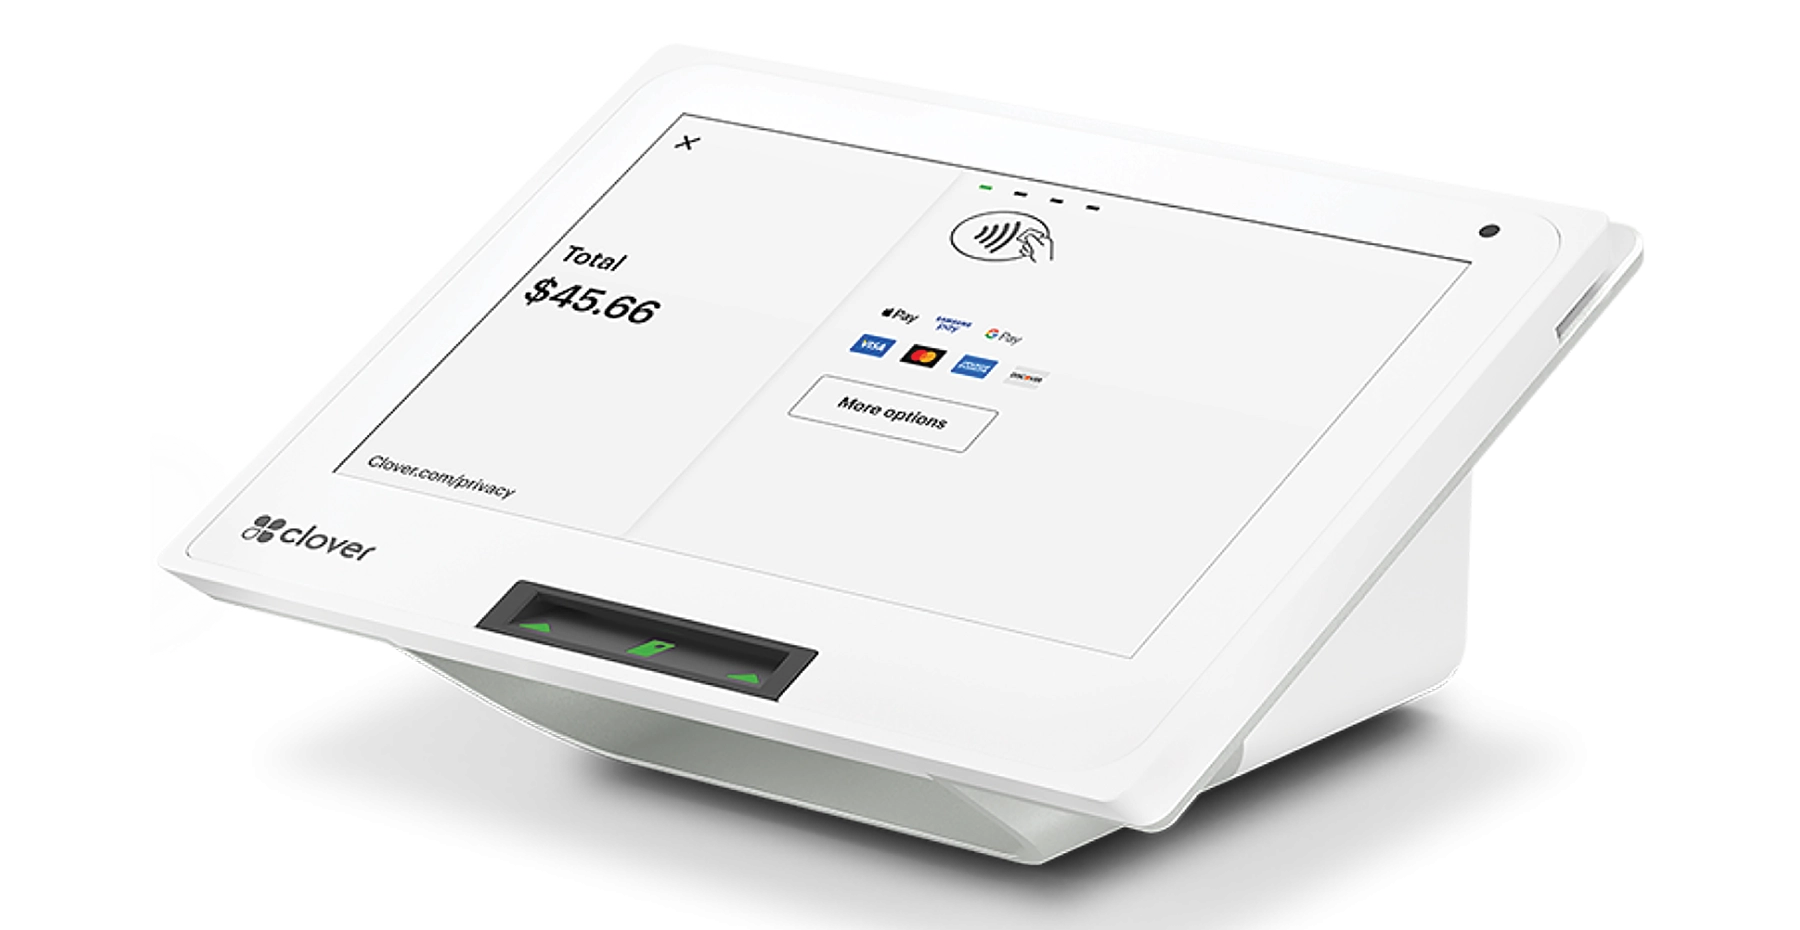
On a Clover system, whether that’s a countertop Clover Mini or a handheld Clover Flex, the reports show which days carry the most volume and where your seasonal patterns sit. Pair them with your processor’s deposit reports and you can see exactly when each day’s card sales turn into cash in your account — the single most important timing detail on the whole 13 week cash flow sheet. Retailers in particular benefit, because their weekly swings are big enough to matter; our page on payment processing for retail covers the setup most shops use.
If you’d rather not build the spreadsheet alone, the VMS team can walk through your deposit timing and fees with you. Our Merchant Services FAQs answer the most common funding questions, and you can always reach our support team directly.
Want more cash in the weeks that matter?
VMS reviews your deposit timing and processing costs for free, usually within one business day.
Or call our team: 888-902-6227
Start Your 13 Week Cash Flow This Week
You don’t need a finance degree, and you don’t need to get it perfect. Open a spreadsheet, list what you have, what’s coming in, what’s going out and when, and stretch it across thirteen weeks. The first version will be rough. The fourth will be surprisingly accurate. And the next time a lean week comes along, you’ll see it a month and a half before it arrives.
If you already follow a broader cash flow management routine, the 13 week cash flow forecast slots right into it as your weekly check-in — the one number you glance at before you approve a big order or schedule an extra shift.
And when the forecast points at faster deposits or lower fees as your best lever, that’s where VMS comes in. Velocity Merchant Services has helped small businesses accept payments since 1998, and a free rate review takes just a few minutes. Fill out the form below and a VMS payment specialist will show you exactly what faster funding and lower processing costs would do to your numbers.
Have questions about your 13 week cash flow?
Fill out the form below and a VMS payment specialist will contact you shortly.